The Potential for Digital Olfaction Solution in Ingredient Supplier Grading
For incoming raw materials and ingredients, digital olfaction solutions offer a rapid assessment of fragrance or flavor quality. These tools can be used to provide a quick “pass,” “fail,” or “needs further analysis” grade to incoming materials. This gives manufacturers confidence that raw materials pass quality standards before accepting shipments or adding them to the production line.
This paper examines the use of digital olfaction tools from Aryballe to evaluate vanillin in multiple forms, from multiple suppliers to create a framework for integrating this data into existing supply chain workflows.
Background
During incoming inspection, raw materials are compared to a reference sample, generally the last sample received and accepted of that ingredient. One immediate complexity is to ensure that the reference sample’s odor is not evolving over time, even when all good practices are in place for its storage in appropriate
conditions. It also means that gradual shifts are not precluded – a batch received years before may have had a distinct olfactive quality that could not be traced. This is particularly true when working with ingredients derived from living materials.
Digital olfaction provides standard measurements and a central database capable of accumulating years of records. This brings much needed traceability and documentation capabilities to the process. Odor signatures recorded from previous shipments, lots and even years can be easily compared with increased visibility of the evolution of raw materials’ odors.
Raw materials sourcing and supply chains are being affected by climate change and the stricter CSR commitments made by major global manufacturers. Some suppliers with disputable practices are being replaced by more responsible and ethical growers. The increasing attention to sustainability is also driving raw material buyers away from field-grown products and towards alternative suppliers, such as genetically-modified microorganisms producing flavors and fragrances from sustainable materials, sometimes even byproduct of other manufacturing processes.
With these novel sources of raw materials comes the need to compare them with the reference compounds for a variety of criteria, including odor or flavor intensity, nature, time remanence, and time stability to achieve consistency, or maybe even bring additional qualities compared to the classical solution. This wide range of dimensions can be assessed, recorded and compared using digital olfaction tools.
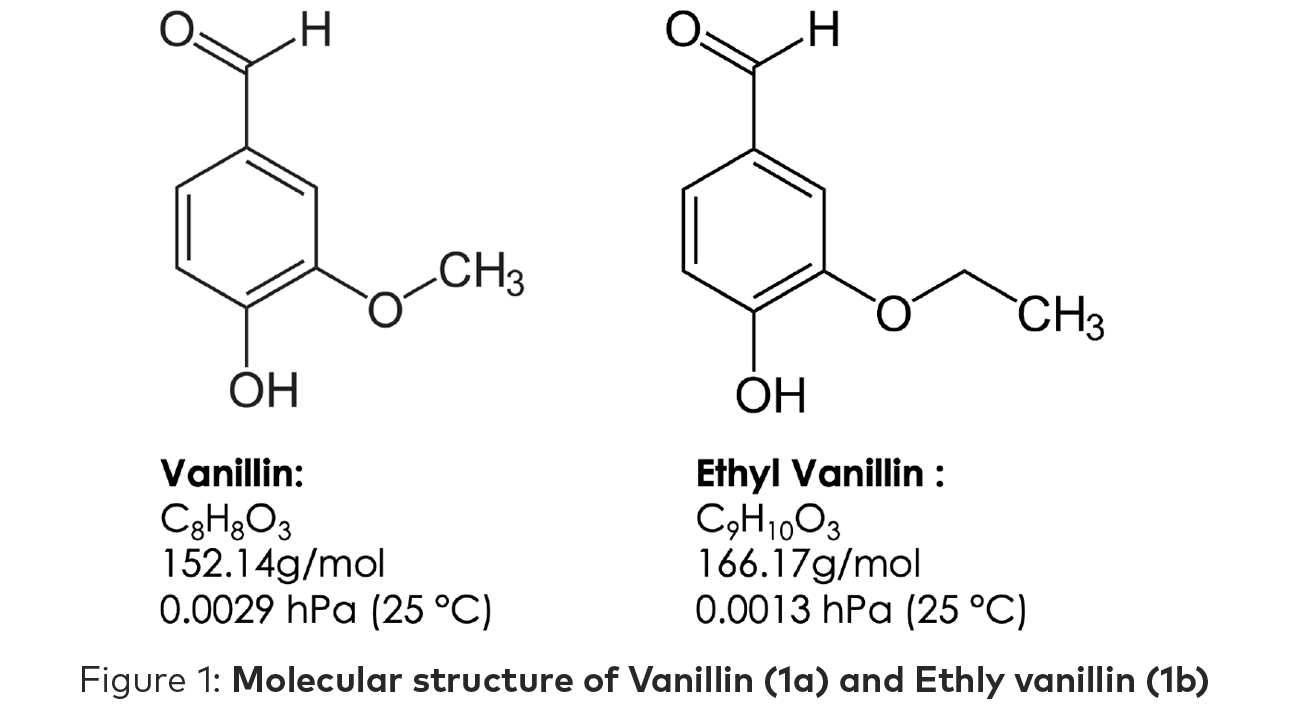
While the molecular structure (Figure 1a and 1b) of vanillin and ethyl vanillin are similar, the human experience is quite different, and this difference can easily be distinguished by the human nose. Vanillin is often described as sweet and chocolate—more pleasant than ethyl vanillin which is often described as creamy and reminiscent of root beer.
Material & Method
This study used Aryballe’s NeOse Advance which is an instrument with embedded humidity and temperature sensors along with Aryballe’s Core Sensor which captures odor signatures. The Core Sensor is based on an array of Mach Zehnder Interferometers grafted with Aryballe’s proprietary combination of biosensors. The signal detected from an odor depends on the interaction between VOCs from the samples and these biosensors. A different intensity signal is measured for each biosensor in link with the affinity between the VOCs and the biosensor. The pattern of the reaction for all the biosensors for one odor is called the “olfactive signature.”
The olfactive signatures are compared and statistic methods are applied for analysis of the odors in the
study using the software tools from Aryballe.
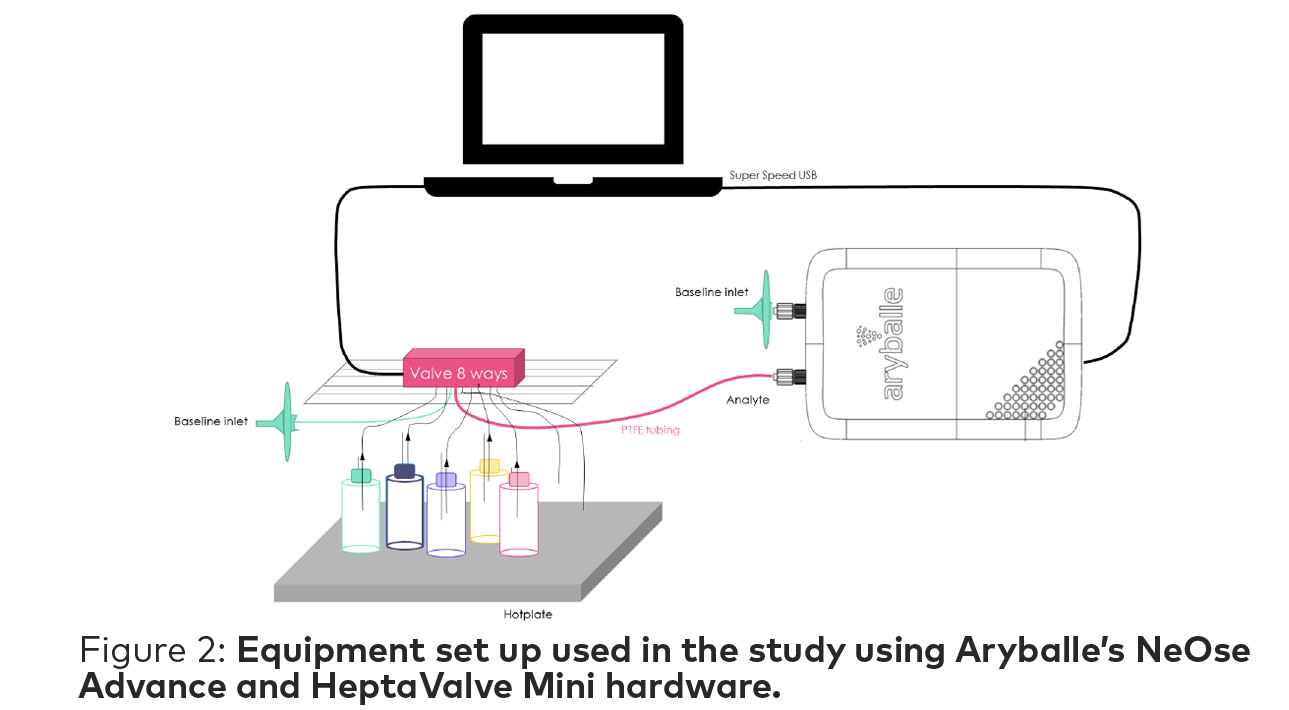
The HeptaValve Mini is an automatic valve which enables analysis of seven samples in the same experiment set up to improve the repeatability of the results while optimizing workflow. The sample collection tube is placed inside of the vials through the septum of the cap equipped with a vent system to avoid depressurizing the vial. Another tube connects the whole valve system to the NeOse Advance. (Figure 2)
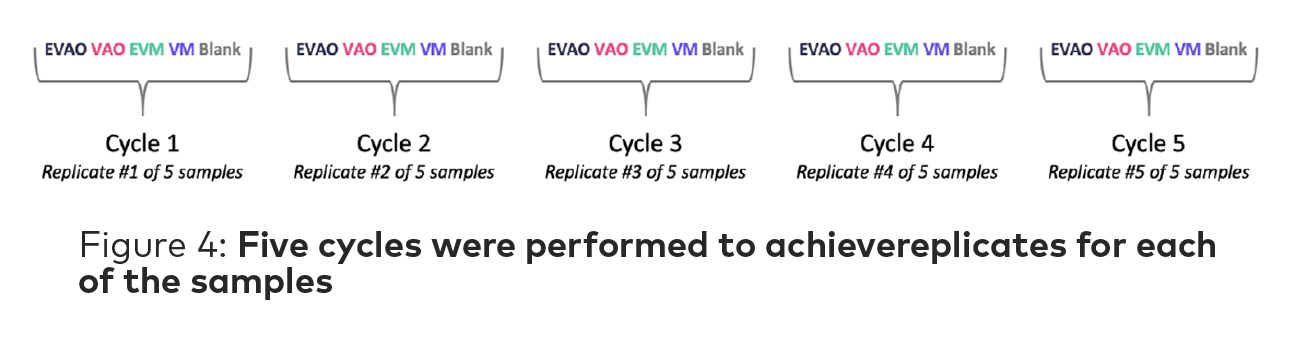
1. Ethyl vanillin-Acros Organic (EVAO)
2. Vanillin-Acros Organic (VAO)
3. Ethyl vanillin-Merck (EVM)
4. Vanillin-Merck (VM)
5. Blank (empty vial)*
*The empty vial is used as a negative control for the experiment and not represented in any analysis data.
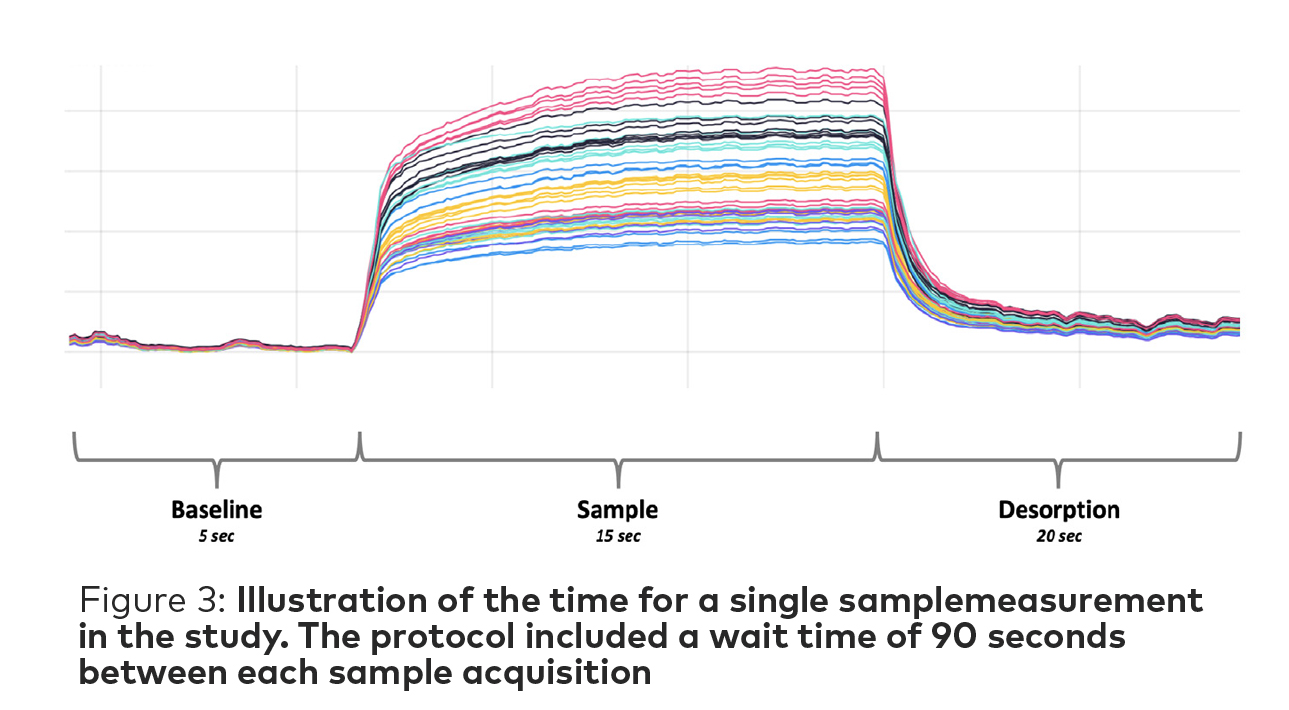
Each vial was placed in a dry bath at 50°C for 30 minutes before measurement to allow a uniform headspace to develop. The NeOse Advance flowrate was set at 60 mL/min and with a 90 second wait time between measurements to allow the adequate headspace to reform in the vial. The total time for measurement of a single sample was of 130 sec (Figure 3).
The HeptaValve Mini takes measurements by alternating between a baseline and the sample vials. A cycle is complete when all samples have been analyzed. In this study, five cycles were performed for a total of five replicates of each sample for the analysis (Figure 4).
Results & Analysis
Normalized odor signatures are captured based on mapping the individual peptide response to an odor on a radar chart. For each sample, the biosensor that reacts the most is normalized to 1 while the biosensor with smallest reaction is normalized to zero—and then all the other responses are mapped from 0 to 1. This gives us the unique fingerprint of the odor, independently of odor intensity.
The signatures captured by the NeOse Advance (Figure 5) show a similar peptide response for many of the biosensors—as is to be expected as the odor profiles are very close for the human nose.
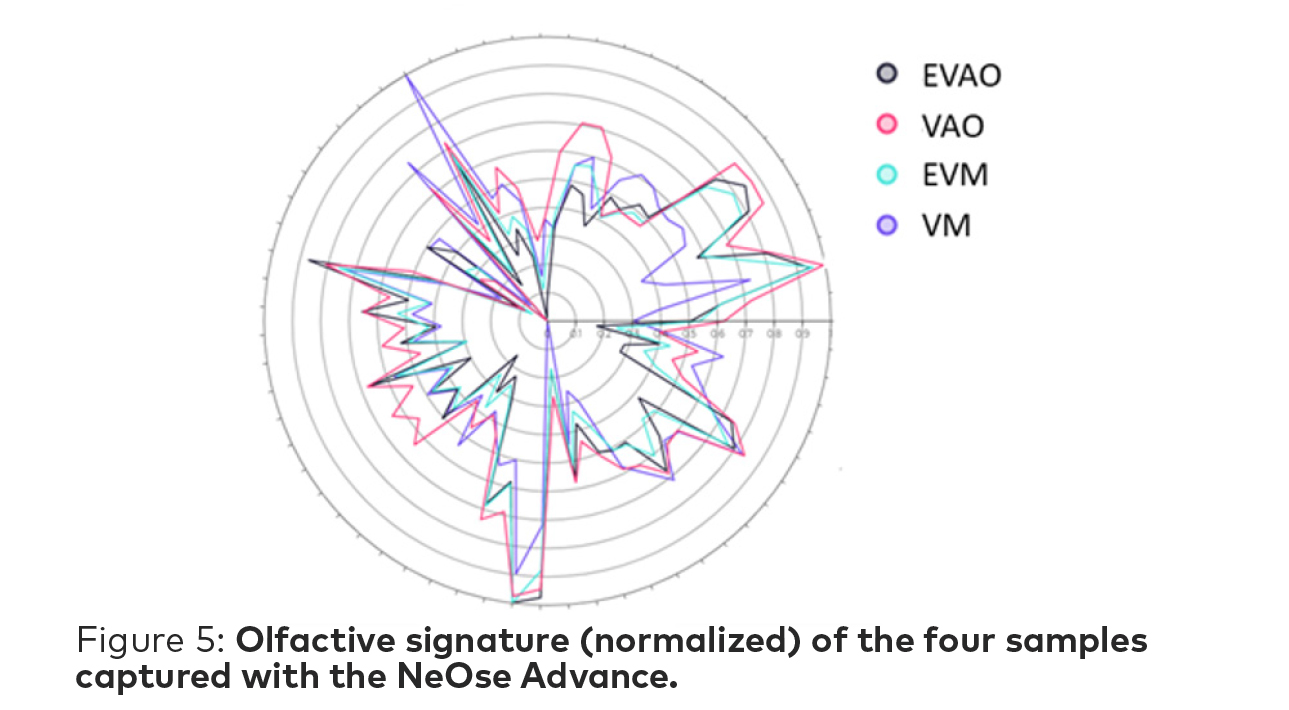
It can be noted that there is the highest degree of overlap on the two ethyl vanillin samples from the two suppliers.
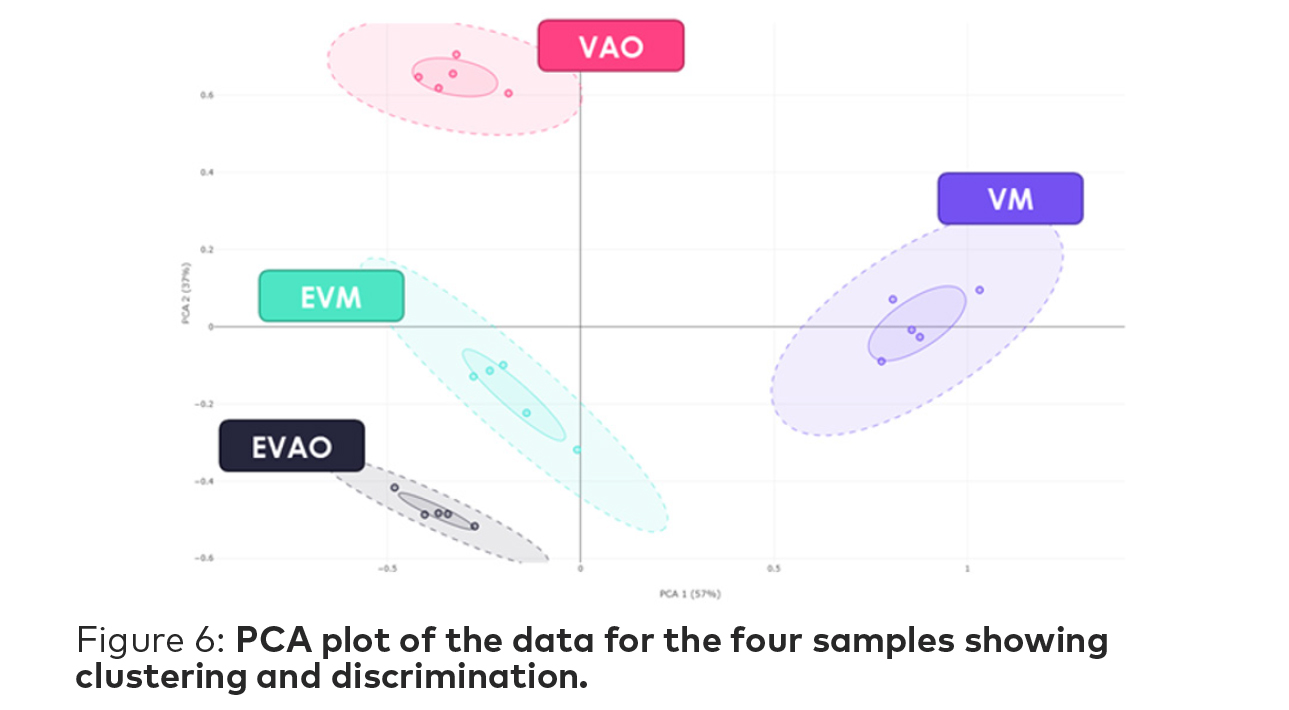
Principal Component Analysis (PCA) is based on calculation of the distances between all biosensors. It is a graphic representation of the relative difference of odors. Datapoints located close to each other indicate a degree of odor proximity, while distant datapoints indicate different sample odors.
Clusters are represented with solid and dotted line circles, both centered on the centroid. The solid line represent the average PCA distance of the replicates to their centroid while the dotted line illustrates the average PCA distance plus 2σ dispersion, where 95% of the population would be found.
The PCA plot for this study (Figure 6) shows clustering across each of the four samples—with the two ethyl vanillin clusters being the closest. The two vanillin samples from each supplier are quite far apart and do not exhibit significant proximity with either if the ethyl vanillin clusters.
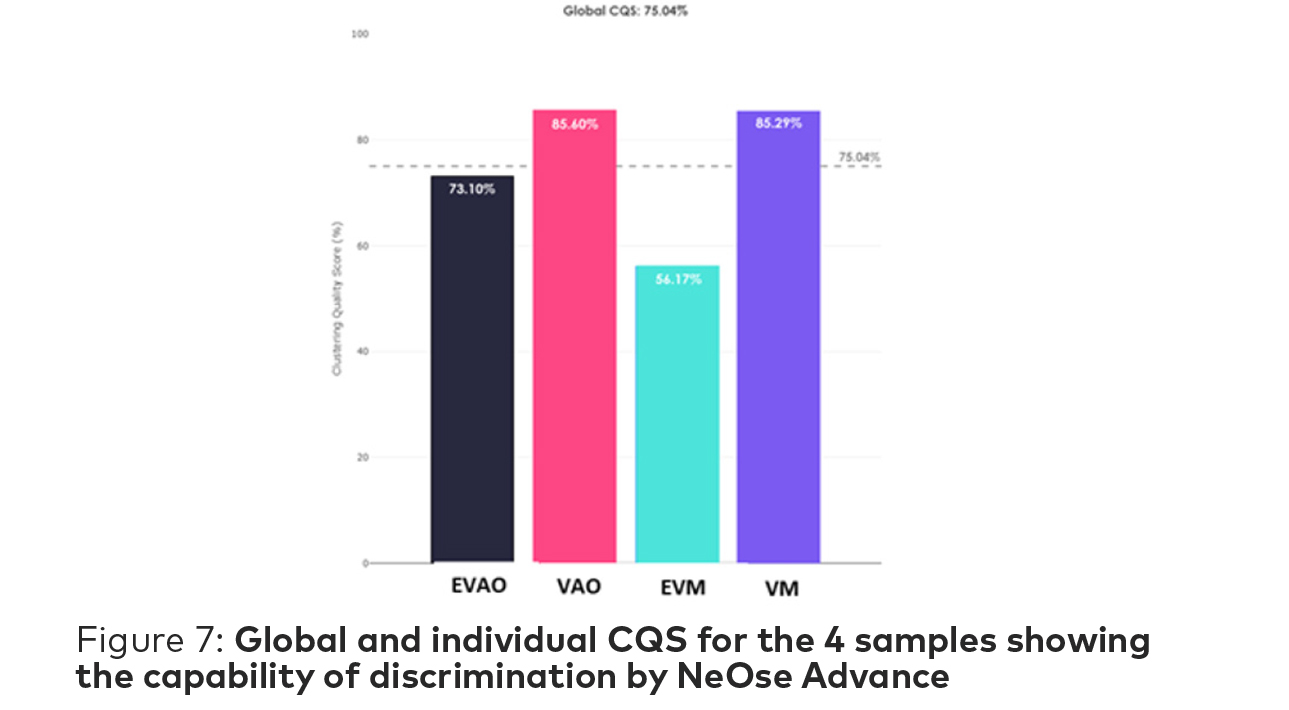
Clustering Quality Score (CQS) is an Aryballe metric to determine the quality of separation between multiple odors that is independent of any classifier and thus does not require
any previously built library to be applicable. Considering a set of data categorized in common clusters, CQS can be considered at 2 different scales. The first one, the Global CQS, i.e. the score representing the quality of the global separation, i.e. the partition. On a set of N different clustered odors, it is only 1 number. The second one, the Individual CQS, i.e. the score representing the quality of each individual cluster among the other clusters. On a set of N different clustered odors, it is N numbers.
For this study, the Global CQS is 75.04% which indicates a good global separation of the four samples. Each individual CQS is higher than 50% meaning that each sample is well discriminated and replicate measurements across the experiment time group into a fairly tight cluster.
Altogether the data presented here show that NeOse Advance can readily differentiate vanillin from ethyl vanillin. Furthermore, they highlight that vanillins obtained from two different suppliers, VAO and VM, have significant differences allowing to differentiate them in radar charts and PCAs. Conversely, ethyl vanillins from two different suppliers, EVAO and EVM, share a number of similarities and are thus not as straightforward to be distinguished.
Organizations could look at this data and decide that when looking for second suppliers for their ethyl vanillin products, the distinction between the two suppliers can be under their defined threshold, and thus can make decisions based on other factors like pricing or delivery times.
However, when sourcing a vanillin ingredient from either supplier, the distance between the odor profiles are much more significant, so there is more impact on the end product when switching suppliers.
Quality control and manufacturing teams can use the analysis from digital olfaction tools from companies like Aryballe to inform ingredient supplier decisions that use consistent, objective odor data. This example outlines how an organization could use the data to either identify when a second source is acceptable or when formulations are greatly impacted by a change in supplier.
At Aryballe, we have worked extensively with R&D teams to validate our digital olfaction hardware-enabled software to assist in formulation and development process. And now we’re seeing these standards passed onto the quality and manufacturing teams so they can leverage odor data to enhance end products and ensure product quality for the customer. Integration of these solutions into normal supply chain decision making is one way manufacturers are transforming odor data into business assets.