It’s no surprise to hear that the US coffee is a primary caffeinated beverage of choice, with the average coffee drinker drinking between two to three cups per day since the 1990s. However, what has changed in recent years is the type of coffee being consumed—the third wave of coffee. The National Coffee Association reported in 2017 that 59% of coffee consumed is classified as “gourmet” – the first time that number has broken 50% in the 67-year history of the report.
This shift in the American coffee consumer landscape means that more people are drinking higher priced coffee—and understanding that it’s not just a skilled barista that makes a coffee great. But consumers are more educated on the impact producers and roasters have on the end product. And they now view coffee as an affordable luxury rather than just a breakfast staple.
This rise in consumption of gourmet coffee extends beyond the corner coffee shop and into grocery shelves as well. Long home to traditional whole bean and ground variations, grocery shelves are now stocked with a new fast-growing segment of ready-to-drink coffees available in bottles, boxes and cans.
Challenge
As the third wave of coffee takes hold, we’re seeing more consumers appreciating the quality of the coffee, often demanding new ways to improve not just access but quality across the coffee supply chain. They key characteristics of the third wave of coffee center around ways to increase coffee quality, including more direct trade channels, increased emphasis on sustainability, modified roast profiles and innovative brewing methods.
As the coffee market strives to quantify, control and meet the requirements of consumers, they are looking to new methods to ensure coffee quality. Enter digital olfaction—a way to characterize and control one of the central parameters to the coffee experience, the smell.
Although coffee is characterized in every way throughout the process from distribution of bean size to roasting temperature and color to grind particle distribution, sensory analysis still heavily relies on human cuppers and panels. With these panels, the best way to ensure consistency in batch to batch quality analysis includes understanding cupper personal preferences and habits.
Solution
Digital olfaction offers a better way. Digital olfaction combines biosensors, advanced optics and machine learning to mimic the human sense of smell. Digital olfaction solutions allow for objective classification and characterization of odors to enable better decision making across the coffee supply chain.
To illustrate this, Aryballe tested five different coffee products in three different coffee phases—whole bean, ground and liquid—to determine the ability of their NeOse Pro to classify the results.
The experiments were performed with a NeOse Pro equipped with a Heptavalve to ensure repeatability and consistency of samples (Figure 1). Ten replicates were taken for each sample placed in 60 ml bottles, waiting three minutes between two measurements. Before measuring samples, a minimum of five minutes of waiting time was allowed to ensure complete formation of the headspace in the vial.
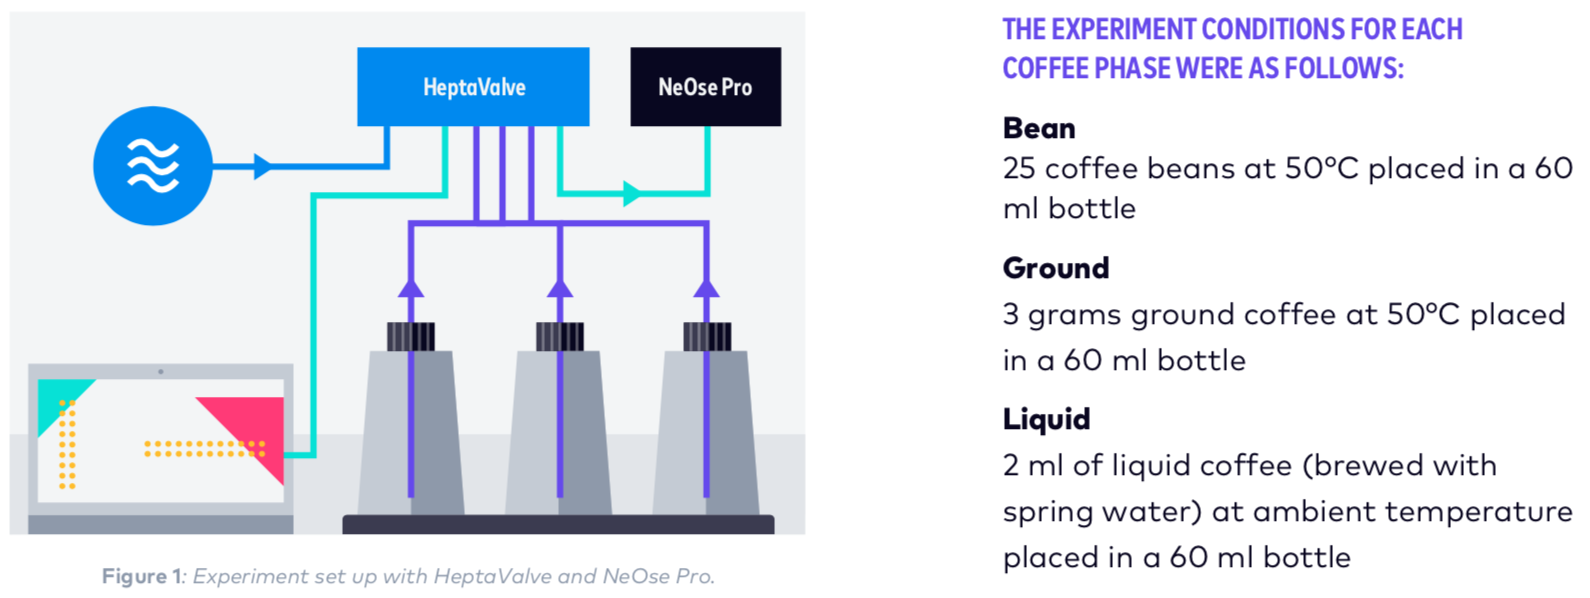
Phase Bean
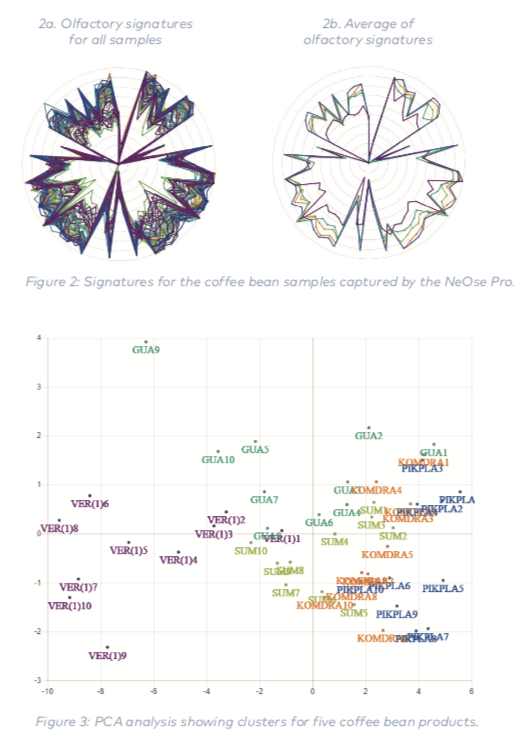
The results of the coffee bean test showed that after the five- minute waiting time, the intensity of the headspace was adequately above the limit of detection for the NeOse Pro for all five products. The device saw significant variance in the olfactory signature replicates across samples of the same product (Figure 2a) — thought to be caused by minor variations bean to bean. Some distinctions in mean olfac-tory signatures were seen across products (Figure 2b).
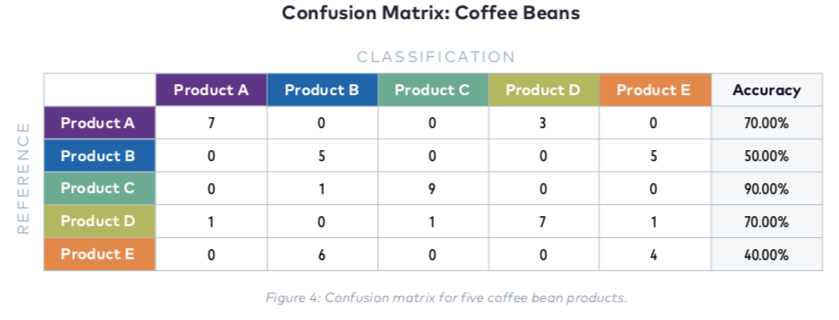
The clustering results (Figure 3) and confusion matrix (Figure 4) for the bean samples showed that although distinguished clusters emerged for some products, advanced analytics would be required for fully positive results.
Phase Ground
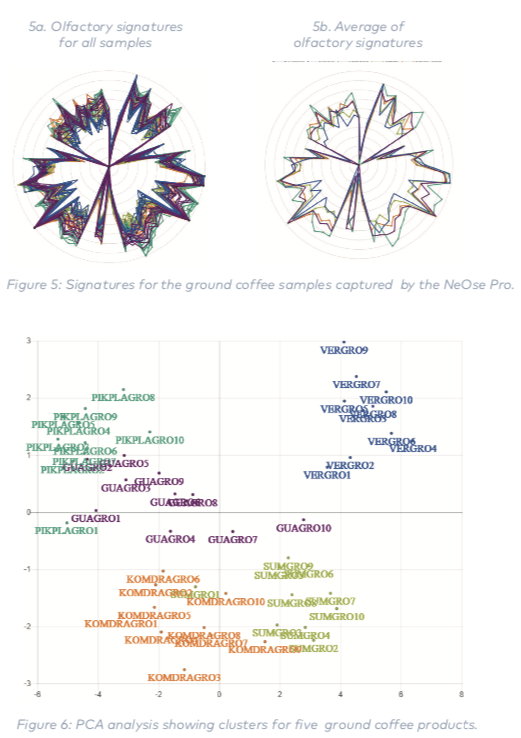
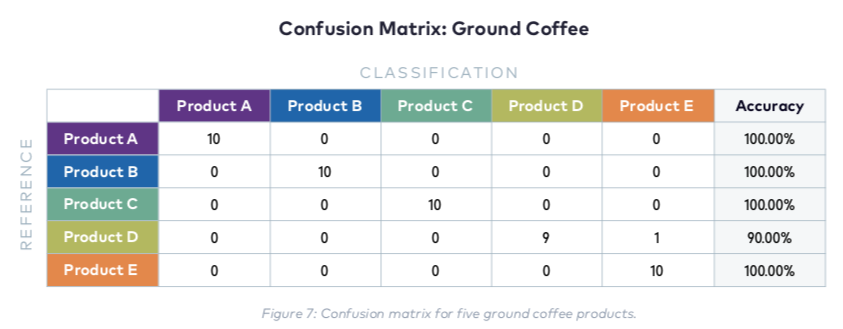
The results of the ground coffee test once again showed that adequate headspace formed above the limit of detection for the device within the waiting period. Unlike the bean samples, the olfactory signatures of the ground coffee saw less variance within the product samples but significant distinctions between the mean olfactory signatures across products (Figure 5). With basic analytics, we were able to see five distinct clusters (Figure 6) — the clear distinction mimicked in the confusion matrix results (Figure 7).
Phase Liquid
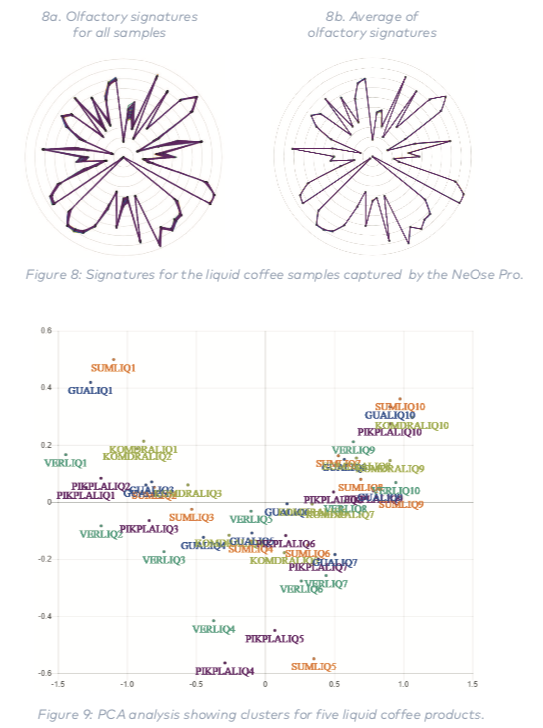
The results of the liquid coffee test showed significant intensity well above the limit of detection for the headspace of the samples. However, the olfactory signatures across samples and products were indistinguishable — thought to be caused by the water bias (Figure 8). As expected, clustering results were not possible (Figure 9), and the confusion matrix showed little distinction across the different products (Figure 10).
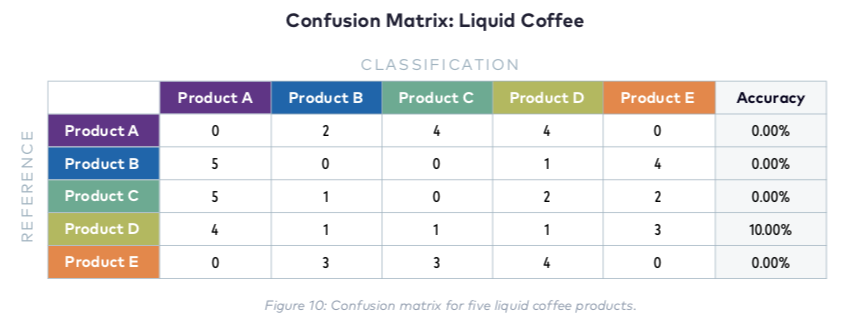
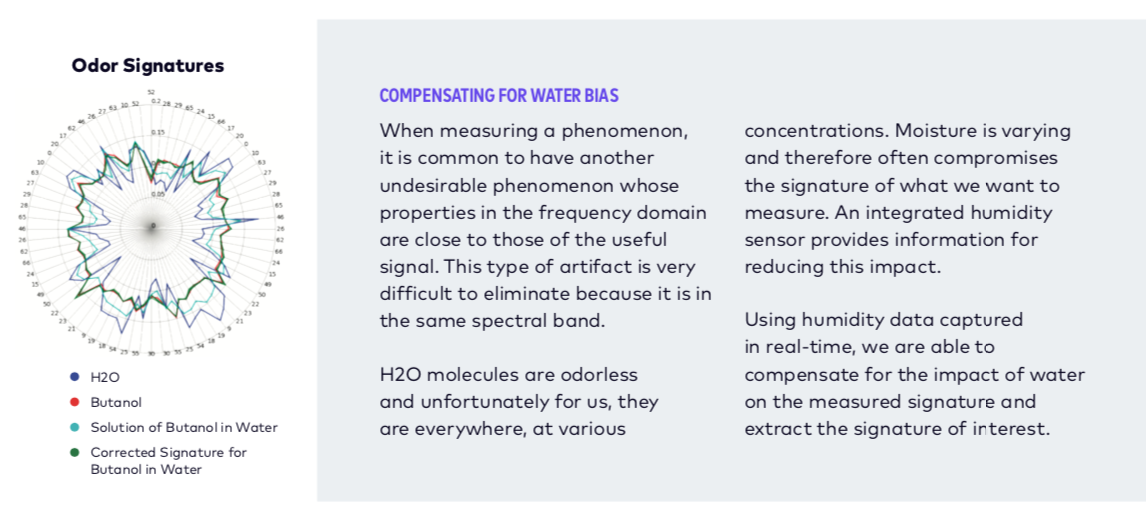
However, with advanced analytics, Aryballe is able to compensate for the water bias — thus given than the ground coffee results are so favorable, it is thought that by compensating for the water bias that clustering results may emerge.
Conclusion
The results of the tests showed that the NeOse Pro can be used to distinguish differences in the coffee samples — ground coffee being the easiest to distinguish with basic analytics, followed by coffee beans. Liquid coffee analysis requires advanced analytics to remove the water bias before determination of olfactory signatures can be performed.