Coffee Aroma Use Case Study
This study performed for MaxiCoffee quantified ground coffee aroma degradation during the first few hours after grinding. Aryballe also examined the characteristics of the aroma and how it evolved over time after grinding.
Overview
In this study, Aryballe worked with MaxiCoffee, a French group specializing in the world of coffee, to study the degradation of aroma of coffee beans immediately after they are ground. The goal of the study was to analyze and quantify the differences between aroma of fresh ground beans and pre-ground and packaged coffee.
Determining aroma loss post-grinding
This study examined three different coffee brands provided by MaxiCoffee. The samples were provided to Aryballe in sealed packs with 250 g of coffee beans each.
To prepare the samples for measurement, coffee beans were ground immediately after opening of a sealed package. The same grinder with the same amount of coffee and the same grain size was selected for the grinding. This allowed us to maintain consistency throughout the grinding phase—which means that the initial aromatic loss due to the friction generated by the grinding wheels remained constant.
Approximately 100g of coffee beans were poured into the beans tray of a professional coffee grinder provided and preconfigured by MaxiCoffee; beans were then ground; first few tens of grams of coffee powder were discarded (used to clean up the grinder); finally, 20 g of coffee powder was poured into 100 ml sampling vials.
An artificially aged coffee powder was used as a negative control. To achieve aging effect, a normally prepared coffee powder sample was left open for 3 days under the laboratory hood. This negative control sample was measured alongside the fresh coffee samples.
The table below details the samples and their notations used throughout this report.
| Sample Name (Brand) |
|---|
| Coffee A |
| Coffee B |
| Coffee C |
| Negative control (aged 3+ days) |
Table 1. Coffee samples details
Results
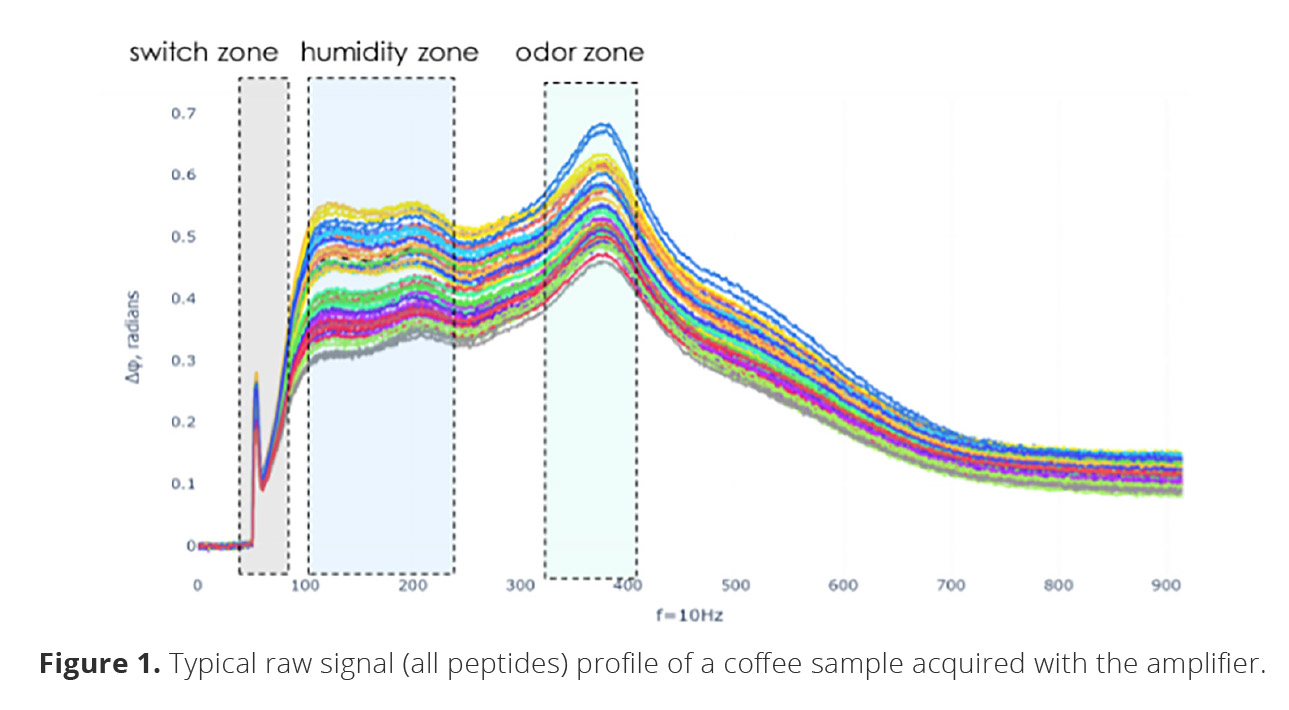
A typical measure of a coffee sample (with Amplifier) is shown on Figure 1. Three peaks (zones) are highlighted. First – a valve switch artifact, second – the humidity zone where water molecules desorb from Tenax resin and contribute to the signal, and finally a third – the region of interest where the odor molecules create a peak signal for the sensor.
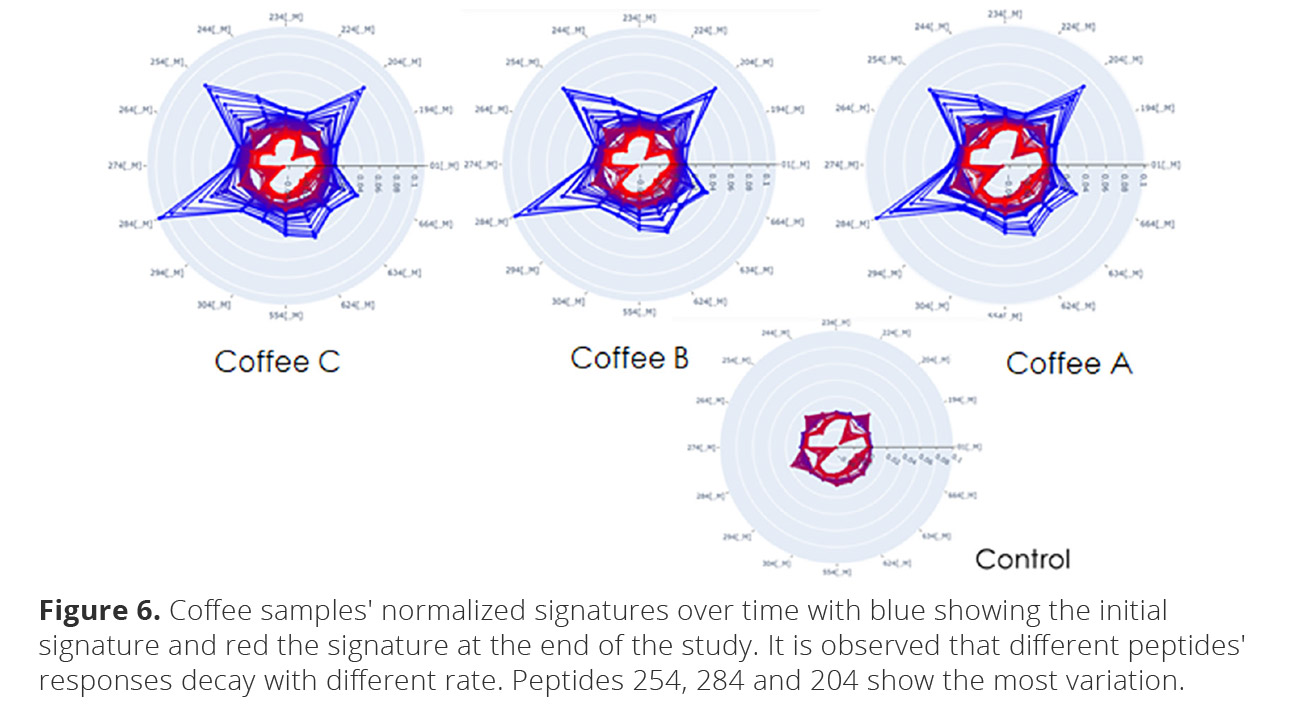
The intensity of the odor for each sample over time is represented as percentage of initial odor intensity after subtracting the residual signal (negative control). This normalized graph is shown on Figure 2.
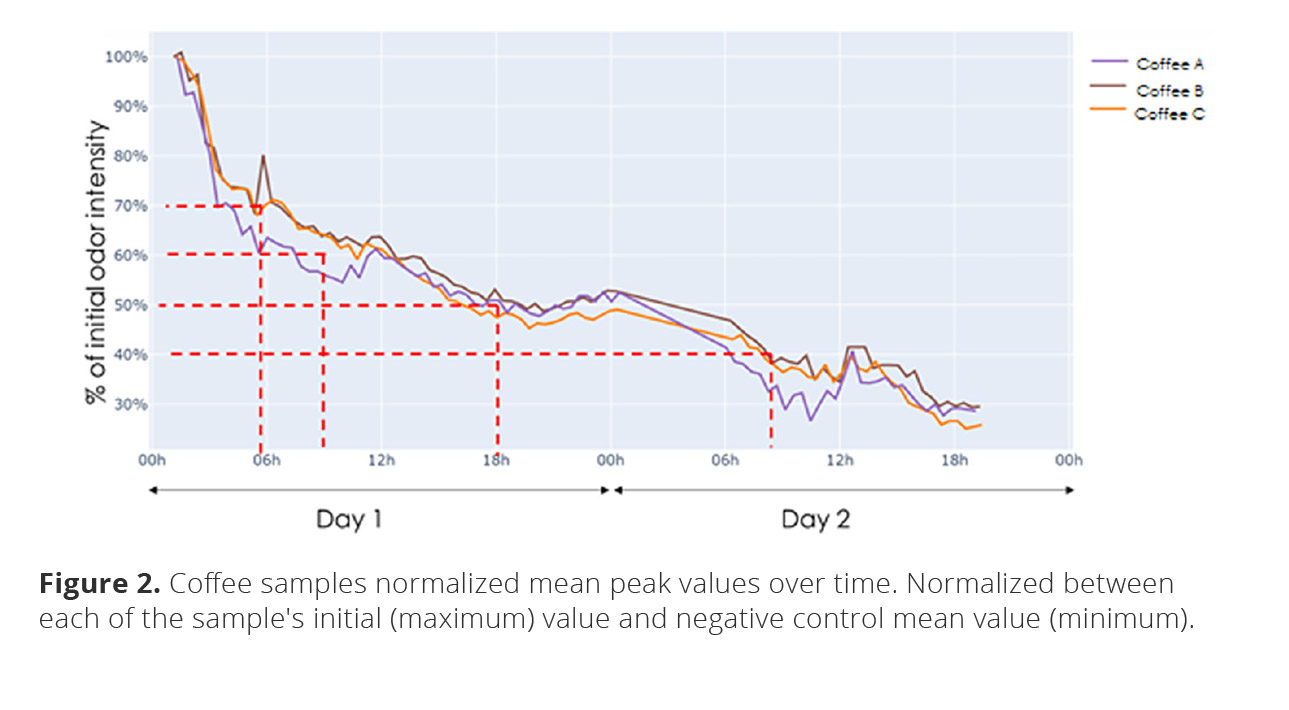
In looking at the change in aroma over a 24-hour period for the different type of storage, the results showed that that freshly ground coffee loses significant intensity over a period of 24 hours.
Examining changes in aroma character
In the second part of this study, reference VOCs (molecules) were used to construct a database of the pure signatures of some of the well-known coffee odor notes. The relation between certain odor notes and their underlying chemical compound responsible was investigated by numerous contributors and overviewed by Buffo et al1. For this study, five major notes were targeted. Their corresponding chemical names and reference CAS numbers are detailed in the table below.
| Odor note | VOC (chemical compound) | Phase | Reference (CAS) |
|---|---|---|---|
| Caramel, sweet | Strawberry furanone | Solid, easily melting hygrospcopic powder | strawberry furanone, 3658-77-3 |
| Cocoa, nutty, almond | 2-methyl furan | Clear liquid | 2-methyl furan, 534-22-5 |
| Fruity, honey | Beta-damascone | Clear liquid | beta-damascone, 35044-68-9 |
| Toast, roast, sulfurous | Furfuryl mercaptan | Yellow oily liquid | furfuryl mercaptan, 98-02-2 |
| Smoke, spice, woody | Guaiacol | Clear liquid | ortho-guaiacol, 90-05-1 |
Table 2. Reference compound details
Chosen pure chemicals have strong distinct odor and do not require amplification or humidity removal so they were measured directly by the NeOse Advance. The HeptaValve Mini was used to automate the acquisition. The obtained signatures were stored in the database and were later used in analysis.
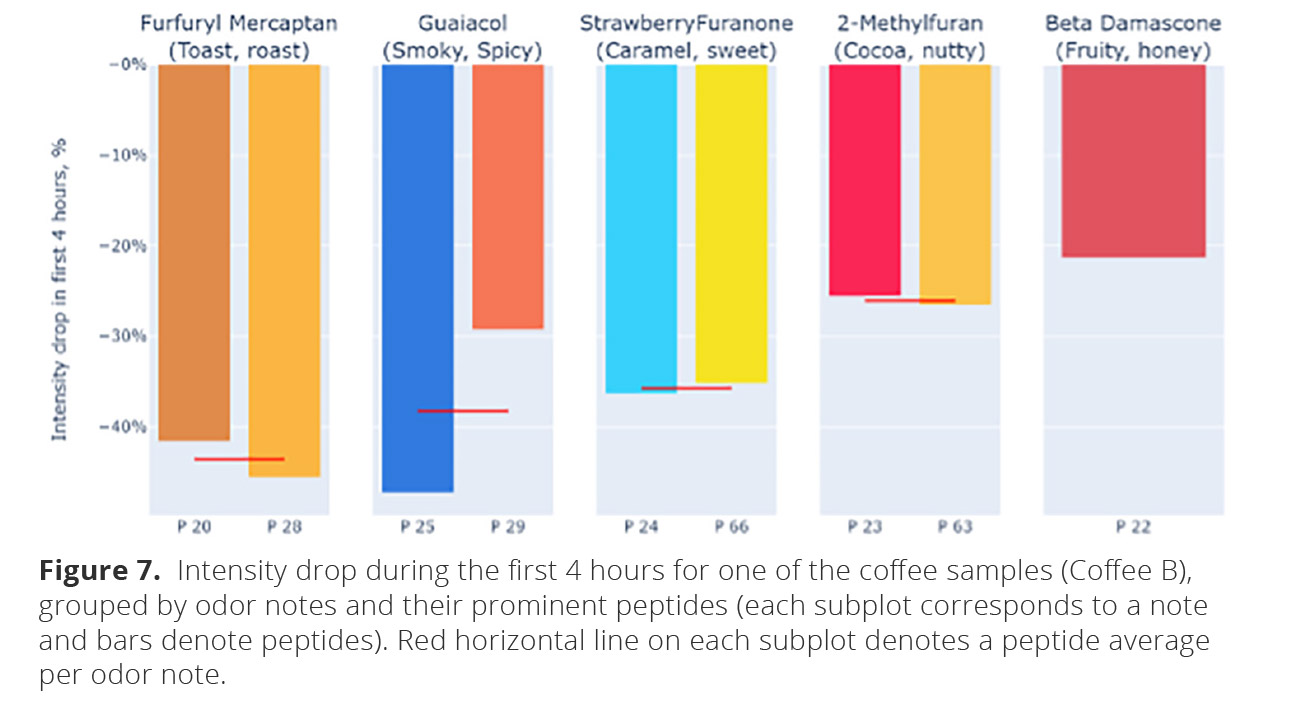
Specific peptide response variation
To study how different specific odor notes behave, we mapped Aryballe sensor peptides responses to specific chemical compounds that attribute to different aroma notes. The per-peptide normalized responses on five major reference compounds are shown on Figure 5.
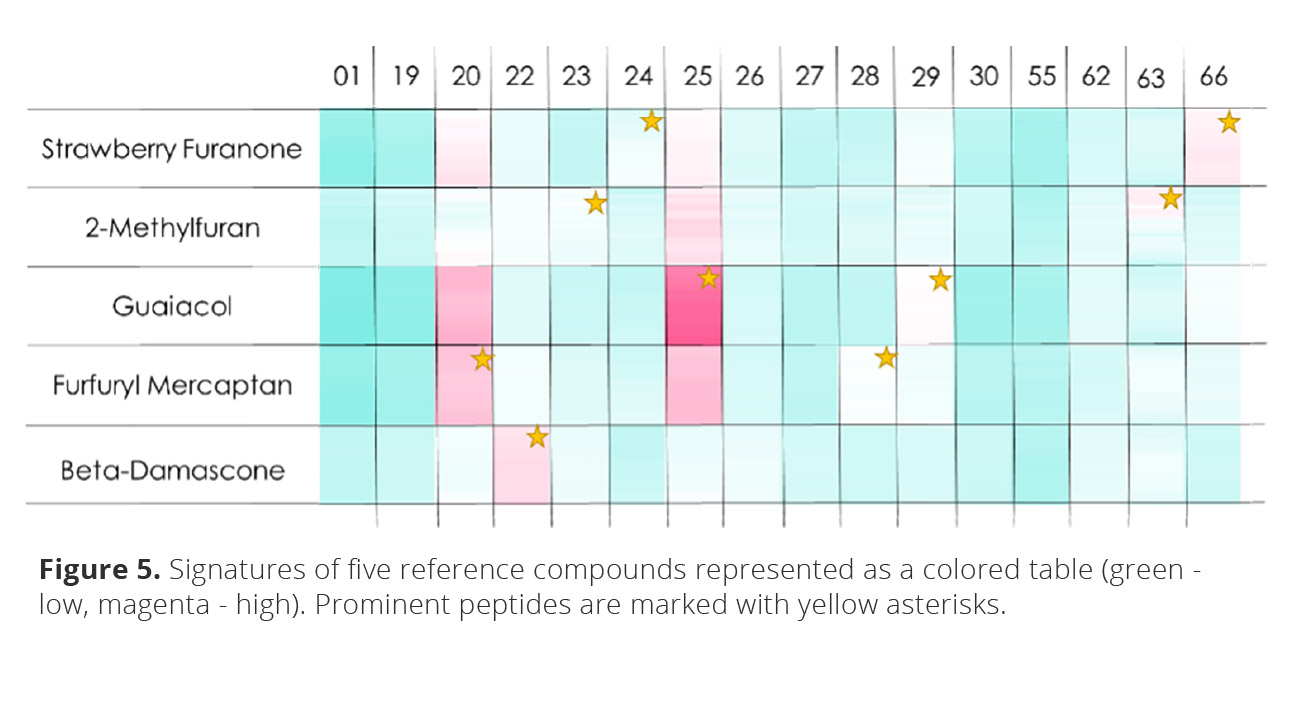
| Odor note | VOC (chemical compound) | Prominent peptides |
|---|---|---|
| Caramel, sweet | Strawberry furanone | S24, 66 |
| Cocoa, nutty, almond | 2-methyl furan | 23, 63 |
| Fruity, honey | Beta-damascone | 22 |
| Toast, roast, sulfurous | Furfuryl mercaptan | 20, 28 |
| Smoke, spice, woody | Guaiacol | 25, 29 |
Table 3. Prominent peptides for each of the reference compounds
Conclusion
Part one of this study found that ground coffee odor degrades over time and the rate of this degradation was quantified. Fifty percent of initial flavor is lost during the first 24 hours after grinding. The second phase of the study found that different aroma notes degrade at different rates.
Armed with this data, MaxiCoffee can confidently point to the higher quality coffee experience enjoyed by consumers who buy whole beans and grind them before brewing rather than purchasing pre-ground and packaged coffee products. Aroma and flavor notes are a critical part of the coffee-drinking experience, and not only does this study show that intensity is lost over time but that the aroma profile actually changes significantly as different flavors degrade faster than others, potentially leading to a much different cup of coffee than the roaster and producer intended.